https://thebulletin.org/2018-doomsday-clock-statement
So... Who's prepping? Anyone?
https://thebulletin.org/2018-doomsday-clock-statement
So... Who's prepping? Anyone?
That clock has been close to midnight my whole life. 69 years.
If they do start throwing nukes about I would hope one hit me on the head rather than a close miss killing me by a slow death from radiation.
In other circumstances such as an epidemic or climate change I am in a location where a subsistence existence could be possible for a time.
Private water supply gravity fed, sewage system , solar panels which could be modified to provide DC power in daylight hours, wood burner with back boiler for hot water and a gravity fed radiator. Problem is when other survivors notice that I (or whoever is living here) would be run off or killed without doubt. When push comes to shove I would do the same but I am too old to put up much of a fight. I have no weapons apart from axes and knives.
I would hope my wine cellar was well stocked. :)
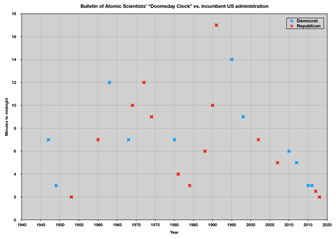
Well, of course the clock has always been close to midnight. Maybe this'll help:
The point is, it's as close to midnight now as it has ever been.
1953: Two minutes to midnight.
1960: America nearly launches unprovoked nuclear strike on Russia when NORAD early warning system mistakes the rising moon for a Soviet first-strike
1962: Cuban Missile Crisis
1983: Operation Able Archer. Stanislav Petrov saves the world & is court-martialled.
Here's a chart showing the magnitude and direction of each change to the clock, again coded for the party of the incumbent president. I'm really surprised by this, but the data says that the net change under Democrats was an overall swing of 18 minutes towards midnight , whereas the Republicans saw an overall swing of 11 minutes away from midnight.
If you accept that the party in office actually has any bearing on the global security situation, the data rather implies that right wing US governments make the world a safer place(!) Note however that with so few data points, you could well get the opposite result if you ran the same experiment again - maybe the reality is that, rather like the stock market, no one is really in control at all...
As for what made the scientists alter the clock each time, you can find that information at: https://thebulletin.org/timeline
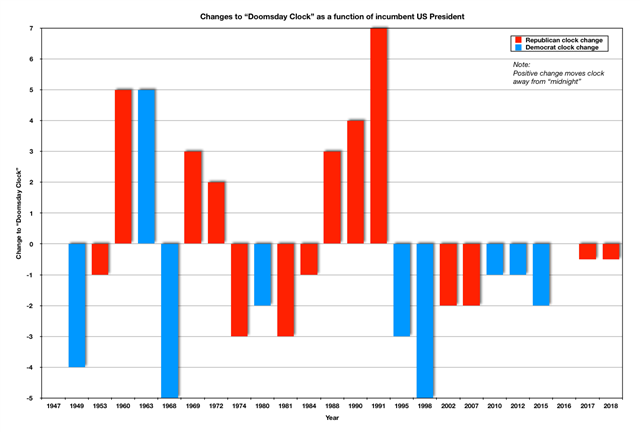
Thanks for the tip, I managed to see a bigger version. The pattern does seem to be similar to your first graph but as I said earlier this might just be a coincidence. I guess the only way to know for sure if there is any political connection is to ask the scientists themselves what influenced them to alter the clock.
Struggling to read
If you click/tap the graph, do you see a bigger version that you can zoom?
Yes, it's the same timeframe. Democrat (blue) / Republican (red) shows the political allegiance of the incumbent president at the time the clock was adjusted.
I'm not totally convinced (yet) that I can see the pattern you mention, so I might try drawing a different picture.
One additional thought is that even if the red dots are all closer to midnight, does this imply a causal relationship, or that a worsening political situation under democrats leads the nation to swing to the right? To put it another way, do the republicans cause the red dots or are they inheriting a democrat mess? Yes, the most recent dots are both red, but the biggest *drops* since 1991 are all Democrat, whilst the vast improvement 1984 - 1991 are all Republican...
Struggling to read the very small print along the bottom (dates) How does this line up with the dates on your previous graph? Is it the same timeframe? The red dots are definitely closer to midnight than the blue dots.
I guess you are hinting that right wing governments ramp up the rhetoric to keep the electorate looking for bogeymen whilst they are getting fleeced?
Perhaps.
One of my takes on the graph is that the clock was not all that bad during the (sudden) Cuban missile crisis or indeed when the American early warning radar interpreted the rising moon as a vast Soviet attack coming over the pole.
Documented historical facts show that there have been repeated "near misses" with these weapons, even when scientists thought our proximity to war was more distant. So these ongoing hiccups are effectively someone rolling a die: something will go wrong from time to time, because people aren't perfect.
If the political view is more relaxed, it's less likely that someone will misconstrue an errant warning as a real attack.
When the rhetoric ramps up, there is an increased risk of miscalculation, resulting in escalation.
If the so-called leader of the free world is level headed, critical decisions which must be made in a matter of minutes are more likely to be made with due regard to the potential downsides if the incoming information is wrong, even if the situation is tense.
At the height of the Cold War, both sides knew full well that a real attack would begin with a torrential first strike, or a tit-for-tat escalation of an existing conventional conflict. Therefore if the warning systems suggested a single or small handful of incoming warheads, people got suspicious because it didn't fit the expected pattern they'd trained for.
Unfortunately, Kim is likely to limit an initial attack to less than 5 missiles, because he'll be trying to make the US stop and think again. He knows he has no chance in an all-out war.
The US and the DPRK have both been needling one another and point-scoring. Both have leaders that would most likely quickly approve a launch if they thought they were under attack.
The American and South Korean forces seem to be increasingly attempting to goad North Korea into doing something dumb. I do believe that at least some in the American government intend to make good on their assertion that Kim be removed, as long as the folk dying as a result are far away, don't have the same colour skin, and don't have relations that might decide the next US election. This is the same aggressive behaviour that ordered U2 flights over sensitive soviet military sites at the height of the Cuban missile crisis - they tried to goad the soviets so that they would get the pretext they wanted for "defending the American Way"(!)
Similarly, the next logical step for Kim is an atmospheric test of a thermonuclear device, somewhere in the Pacific. The Americans are likely to view such a test as an unacceptable provocation, even though this is "do as we say, not as we did".
NK has repeatedly surprised with its advancing capabilities, so another area to keep an eye on is SLBM, which would render any debates about effective range somewhat moot.
To cap it all, folk that were around during the last war are pretty much gone now. People have forgotten what nuclear weapons really do. Trump has supposedly asked his generals, "but why can't we use them?". Everything today is just a big video game.
In summary, the clock is not a guarantee of war. It is of course just a bunch of scientists trying to say, "Hey, politicians! We're worried!".
War may well not come at all, nothing is certain. But all the pieces are in the right places on the chess board for something to go abysmally wrong here.
I'll leave you with this:
Thanks for this graph DF5 that is very interesting indeed.
What jumps out at me is the political situation when the clock was closest to midnight. Might just be a coincidence but it seems Conservative governments are more scary than Labour ones.:)
So we were last this close during the Thatcher/Reagan years.